Multiple Choice
Refer to the figure showing delta values for plants using three different biochemical pathways for photosynthesis.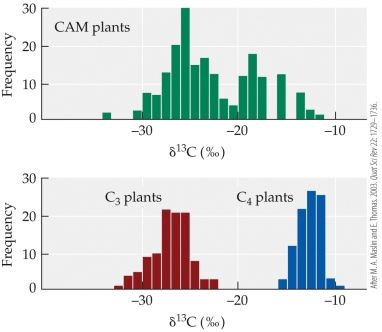 Which of these types of plants shows the most negative delta value, that is, the greatest discrimination against the uptake of 13C?
A) C3 plants only
B) C4 plants only
C) C3 and CAM plants
D) C4 and CAM plants
Correct Answer:

Verified
Correct Answer:
Verified
Q39: Which statement about radiant energy from the
Q40: Orchid species that have lost their ability
Q41: Characteristics of an animal's digestive tract can
Q42: Organisms that can convert energy from sunlight
Q43: Lichens and other Arctic plants can carry
Q45: Which hypothesis about the benefits of photorespiration
Q46: Refer to the figure showing the results
Q47: Suppose a crow normally uses 50 energy
Q48: An autotrophic organism living in a hydrothermal
Q49: Some species in the genus Clusia start