Multiple Choice
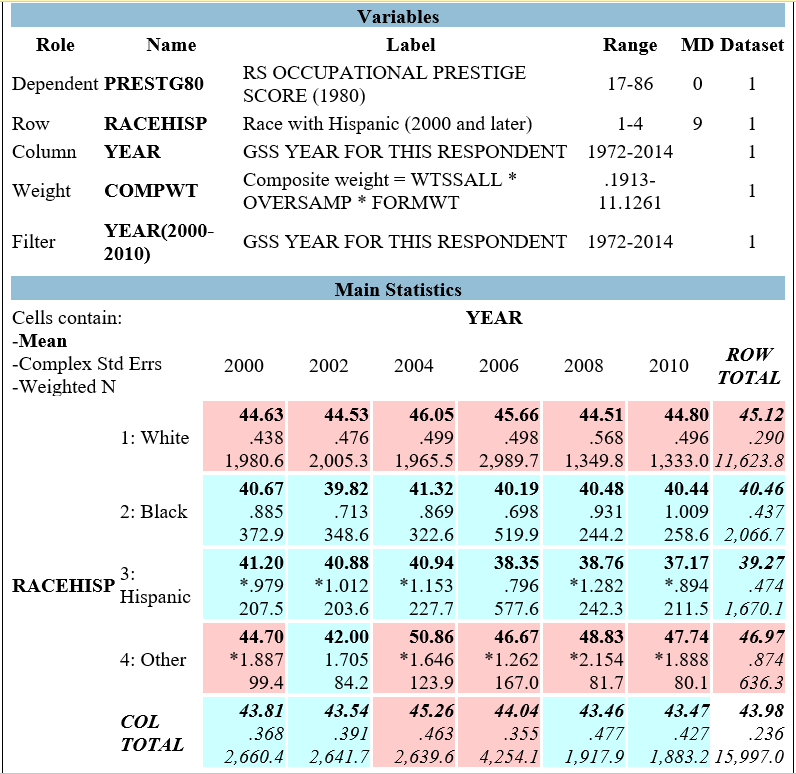 Figure 9.2 shows the results from a comparison of means, using occupational prestige (PRESTG80) as the dependent variable and respondents' racial-ethnic group (RACEHISP) as the independent variable. PRESTG80 is measured on a scale of 17 to 86, with higher scores representing higher levels of prestige.
-In 2010, the average occupational prestige score for non-Hispanic white respondents was approximately:
A) 40.42
B) 44.80
C) 46.93
D) 49.38
Correct Answer:

Verified
Correct Answer:
Verified
Q1: <img src="https://d2lvgg3v3hfg70.cloudfront.net/TBG1012/.jpg" alt=" Figure 9.1 shows
Q3: <img src="https://d2lvgg3v3hfg70.cloudfront.net/TBG1012/.jpg" alt=" Figure 9.1 shows
Q4: <img src="https://d2lvgg3v3hfg70.cloudfront.net/TBG1012/.jpg" alt=" Figure 9.1 shows
Q5: <img src="https://d2lvgg3v3hfg70.cloudfront.net/TBG1012/.jpg" alt=" Figure 9.2 shows
Q6: <img src="https://d2lvgg3v3hfg70.cloudfront.net/TBG1012/.jpg" alt=" Figure 9.1 shows
Q7: <img src="https://d2lvgg3v3hfg70.cloudfront.net/TBG1012/.jpg" alt=" Figure 9.2 shows
Q8: <img src="https://d2lvgg3v3hfg70.cloudfront.net/TBG1012/.jpg" alt=" Figure 9.2 shows
Q9: <img src="https://d2lvgg3v3hfg70.cloudfront.net/TBG1012/.jpg" alt=" Figure 9.1 shows
Q10: <img src="https://d2lvgg3v3hfg70.cloudfront.net/TBG1012/.jpg" alt=" Figure 9.2 shows