Multiple Choice
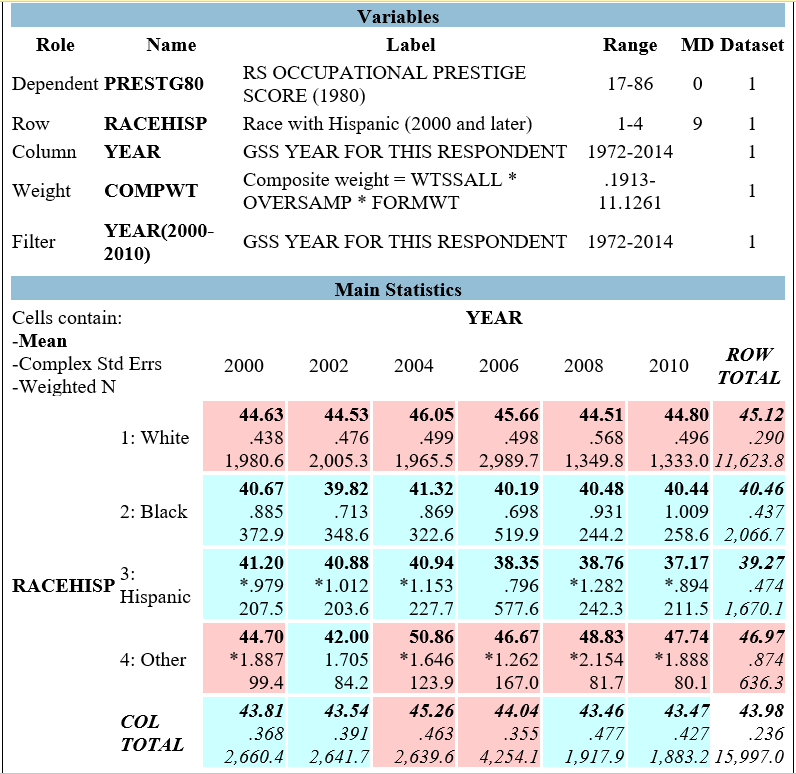 Figure 9.2 shows the results from a comparison of means, using occupational prestige (PRESTG80) as the dependent variable and respondents' racial-ethnic group (RACEHISP) as the independent variable. PRESTG80 is measured on a scale of 17 to 86, with higher scores representing higher levels of prestige.
-The right-most column of the table shows that, for Black respondents, the "Row Total" is 40.46. Which of the following sentences best describes the meaning of this number?
A) From 2000 to 2010, the average occupational prestige score for Black respondents was 40.46.
B) From 2000 to 2010, the average occupational prestige of Black respondents was 40.46 units lower than the average occupational prestige of white respondents.
C) From 2000 to 2010, approximately 40.46% of Black respondents were working in jobs that had high levels of occupational prestige.
D) From 2000 to 2010, approximately 40.46% of Black respondents were working in jobs that had low levels of occupational prestige.
Correct Answer:

Answered by ExamLex AI
Correct Answer:
Answered by ExamLex AI
Q1: <img src="https://d2lvgg3v3hfg70.cloudfront.net/TBG1012/.jpg" alt=" Figure 9.1 shows
Q2: <img src="https://d2lvgg3v3hfg70.cloudfront.net/TBG1012/.jpg" alt=" Figure 9.2 shows
Q3: <img src="https://d2lvgg3v3hfg70.cloudfront.net/TBG1012/.jpg" alt=" Figure 9.1 shows
Q4: <img src="https://d2lvgg3v3hfg70.cloudfront.net/TBG1012/.jpg" alt=" Figure 9.1 shows
Q5: <img src="https://d2lvgg3v3hfg70.cloudfront.net/TBG1012/.jpg" alt=" Figure 9.2 shows
Q6: <img src="https://d2lvgg3v3hfg70.cloudfront.net/TBG1012/.jpg" alt=" Figure 9.1 shows
Q7: <img src="https://d2lvgg3v3hfg70.cloudfront.net/TBG1012/.jpg" alt=" Figure 9.2 shows
Q9: <img src="https://d2lvgg3v3hfg70.cloudfront.net/TBG1012/.jpg" alt=" Figure 9.1 shows
Q10: <img src="https://d2lvgg3v3hfg70.cloudfront.net/TBG1012/.jpg" alt=" Figure 9.2 shows