Multiple Choice
Use the figure The Production Possibilities Frontier I. What is the x-variable in this graph?
Figure: The Production Possibilities Frontier I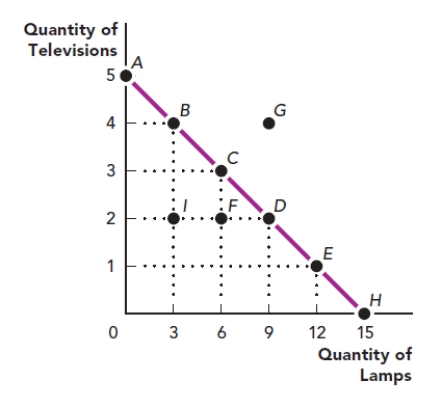
A) point G
B) point I
C) the quantity of televisions
D) the quantity of lamps
Correct Answer:

Verified
Correct Answer:
Verified
Related Questions
Q1: Use the figure Area of a Triangle
Q2: Use Figure: Area of a Triangle I
Q3: Jose has a chart showing the relationship
Q5: A scatter diagram shows a falling pattern
Q6: The price of a good is the
Q7: An economist wants to visualize whether there
Q8: Eloise has data on the different categories
Q9: Use the figure Area of a Rectangle
Q10: Use the figure The Production Possibilities Frontier
Q11: How is the slope of a line