Short Answer
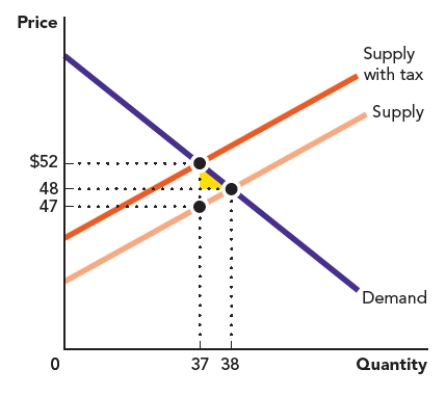
Use the figure Area of a Triangle II. The triangle in the accompanying graph represents the welfare loss to consumers who no longer participate in a market after a tax is placed on a good. Calculate the area of the triangle.
Figure: Area of a Triangle II
Correct Answer:

Verified
Correct Answer:
Verified
Related Questions
Q2: Use Figure: Area of a Triangle I
Q3: Jose has a chart showing the relationship
Q4: Use the figure The Production Possibilities Frontier
Q5: A scatter diagram shows a falling pattern
Q6: The price of a good is the
Q7: An economist wants to visualize whether there
Q8: Eloise has data on the different categories
Q9: Use the figure Area of a Rectangle
Q10: Use the figure The Production Possibilities Frontier
Q11: How is the slope of a line