Multiple Choice
Use the figure The Net Loss to Society Due to the Overproduction of a Good. What is the area of the shaded triangle in this graph?
Figure: The Net Loss to Society Due to the Overproduction of a Good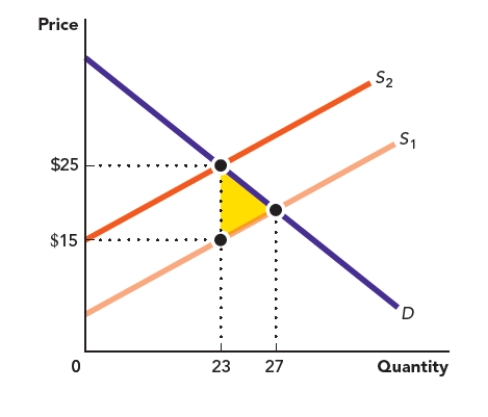
A) $575
B) $40
C) $20
D) $345
Correct Answer:

Verified
Correct Answer:
Verified
Related Questions
Q17: What is represented by a point on
Q18: What measures can take on more than
Q19: The rate at which a line rises
Q20: To find the slope of a straight
Q21: Use the figure The Net Loss to
Q22: Use the figure The Production Possibilities Frontier
Q24: Use the figure Area of a Triangle
Q25: A _ is a graph that indicates
Q26: Use the figure The Production Possibilities Frontier
Q27: A variable that is influenced by another