Short Answer
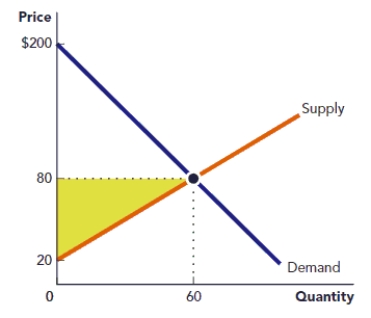
Use the figure Area of a Triangle I. The triangle in the accompanying graph represents the net gain to producers from selling a good. Calculate the area of the triangle.
Figure: Area of a Triangle I
Correct Answer:

Verified
1/2(60) x ...View Answer
Unlock this answer now
Get Access to more Verified Answers free of charge
Correct Answer:
Verified
1/2(60) x ...
View Answer
Unlock this answer now
Get Access to more Verified Answers free of charge
Related Questions
Q17: What is represented by a point on
Q18: What measures can take on more than
Q19: The rate at which a line rises
Q20: To find the slope of a straight
Q21: Use the figure The Net Loss to
Q22: Use the figure The Production Possibilities Frontier
Q23: Use the figure The Net Loss to
Q25: A _ is a graph that indicates
Q26: Use the figure The Production Possibilities Frontier
Q27: A variable that is influenced by another