Essay
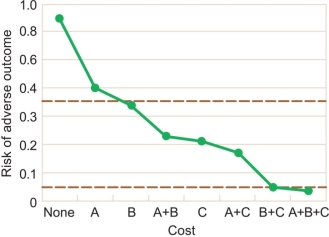
Explain how the graph below can be used in risk analysis.
Correct Answer:

Verified
The graph plots the cost of making adjus...View Answer
Unlock this answer now
Get Access to more Verified Answers free of charge
Correct Answer:
Verified
The graph plots the cost of making adjus...
View Answer
Unlock this answer now
Get Access to more Verified Answers free of charge
Related Questions
Q26: Could population viability analysis be used to
Q27: The process in which a model is
Q28: Computer models are a critical part of
Q29: Policy from non-governmental organizations<br>A) are general in
Q30: The first step in population viability analysis
Q32: Explain how religious institutions and educational institutions
Q33: Policy from the media<br>A) often is motivated
Q34: A new law will impose fines for
Q35: The basic goal of risk assessment is
Q36: Impact assessment includes all of the following