Multiple Choice
Choose the correct interpretation of the charts below. (Note: The x-axes represent the benefit; the y-axes represent the utility.)
Chart A Chart B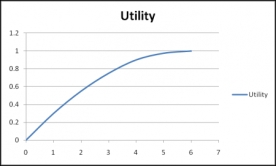
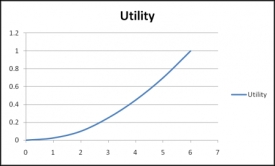
A) Chart A represents risk-aversion and chart B represents risk-neutral.
B) Chart A represents risk-prone and chart B represents risk-aversion.
C) Chart A represents risk-prone and chart B represents risk-sensitive.
D) Chart A represent risk- aversion and chart B represents risk-prone.
E) Both chart A and chart B show risk-aversion.
Correct Answer:

Verified
Correct Answer:
Verified
Q19: Some environmental scientists have interviewed residents in
Q20: When a situation is presented in such
Q21: A community is faced with making a
Q22: Categorize the following people in relation to
Q23: An investor is faced with a decision
Q25: Current energy resources from fossil fuels have
Q26: Suppose you are in charge of holding
Q27: Describe perceived risk and give an example.
Q28: Which of the following statements about excessive
Q29: People tend to be risk-averse when<br>A) paying