Multiple Choice
(Figure: Curve) What does the figure represent?
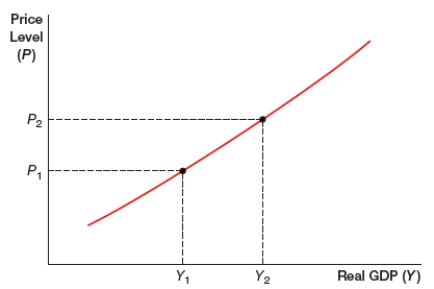
A) long-run aggregate demand curve
B) short-run aggregate demand curve
C) long-run aggregate supply curve
D) short-run aggregate supply curve
Correct Answer:

Verified
Correct Answer:
Verified
Related Questions
Q18: (Figure: Decrease in Short-Run Aggregate Supply) The
Q19: In the markets for individual products, demand
Q20: Why was the 2007 to 2009 recession
Q21: When business cycles are analyzed, what part
Q22: According to the aggregate supply and aggregate
Q24: Which of the following would NOT cause
Q25: When an economy self-corrects from a recession,
Q26: A sudden and large shift in an
Q27: How will an inflationary boom end if
Q28: After a contractionary demand shock, the average