Multiple Choice
(Figure: Decrease in Short-Run Aggregate Supply) The figure shows a shift of a short-run aggregate supply curve to the left due to one or more of the following sources, EXCEPT:
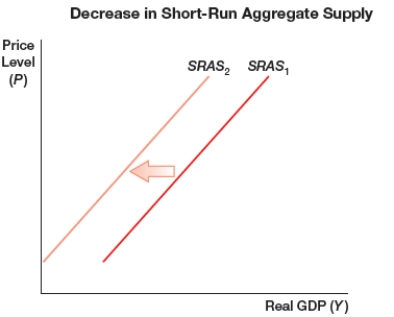
A) decreases in wages.
B) increase in rents.
C) increases in price of raw materials.
D) decrease in productivity.
Correct Answer:

Verified
Correct Answer:
Verified
Q13: In the short run, an expansionary demand
Q14: If a country's aggregate demand falls, output
Q15: Which of the following would cause a
Q16: Which of the following would cause aggregate
Q17: Why does the amount of national output
Q19: In the markets for individual products, demand
Q20: Why was the 2007 to 2009 recession
Q21: When business cycles are analyzed, what part
Q22: According to the aggregate supply and aggregate
Q23: (Figure: Curve) What does the figure represent?<br>