Multiple Choice
(Figure: Lorenz Curve) In the figure, the Lorenz curve representing the deviation from perfect income equality is:
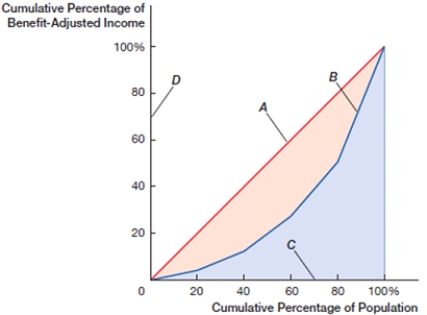
A) A.
B) B.
C) C.
D) D.
Correct Answer:

Verified
Correct Answer:
Verified
Related Questions
Q23: The United States has a slightly _
Q24: Several studies show that over half the
Q25: A quintile is<br>A) equal to 25%.<br>B) a
Q26: _ is the net value of all
Q27: _ is the amount of additional taxes
Q29: (Figure: Lorenz Curve 0) In the figure,
Q30: The Lorenz curve is:<br>A) another name for
Q31: The earned income tax credit is a
Q32: The Gini coefficient is:<br>A) another name for
Q33: _ is the percentage of the population