Multiple Choice
(Figure: Lorenz Curve 0) In the figure, income inequality increases if area _____ gets _____.
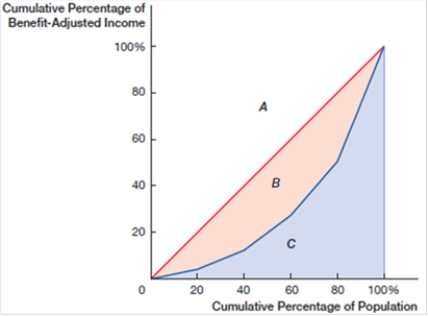
A) A; larger
B) B; larger
C) C: larger
D) A; smaller
Correct Answer:

Verified
Correct Answer:
Verified
Related Questions
Q24: Several studies show that over half the
Q25: A quintile is<br>A) equal to 25%.<br>B) a
Q26: _ is the net value of all
Q27: _ is the amount of additional taxes
Q28: (Figure: Lorenz Curve) In the figure, the
Q30: The Lorenz curve is:<br>A) another name for
Q31: The earned income tax credit is a
Q32: The Gini coefficient is:<br>A) another name for
Q33: _ is the percentage of the population
Q34: The _ poverty rate adjusts income for