Multiple Choice
The accompanying figure details the possible outcomes in a scenario in which 10 zygotes are formed from a gene pool where the frequency of the allele A1 is 0.6,and A2 is 0.4.This graph is shown here.According to this graph,the probability that the frequency of A1 will increase to 0.7 in the next generation is about ________. 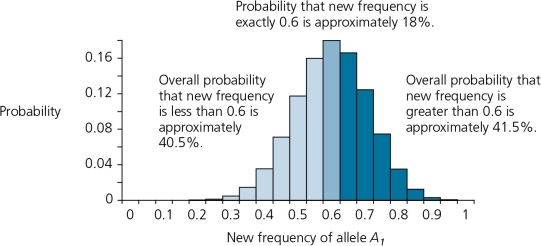
A) 8%.
B) 12%
C) 16%
D) 40%
E) 70%
Correct Answer:

Verified
Correct Answer:
Verified
Q4: At present,the neutral theory of molecular evolution
Q5: The results of an experiment on genetic
Q6: When we track alleles from lineages backwards
Q7: A phenomenon known as _ [one or
Q8: Gene flow through migration _.<br>A) has no
Q10: Data in the accompanying figure shows the
Q11: A locus at which different individuals in
Q12: A scenario in which 250 zygotes are
Q13: The effects of inbreeding depression has been
Q14: In an evolutionary sense,_ is the transfer