Multiple Choice
Consider a lake survey in which the relative amounts of five different types of fish are identified. Which of the following data sets matches the pie chart shown?
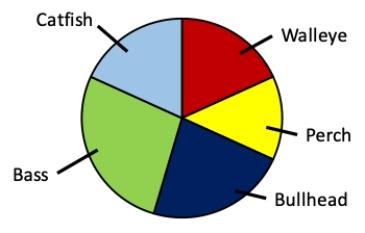
A) 25% bass, 20% bullhead, 25% catfish, 15% perch, 15% walleye
B) 35% bass, 15% bullhead, 15% catfish, 15% perch, 20% walleye
C) 20% bass, 15% bullhead, 25% catfish, 20% perch, 20% walleye
D) 30% bass, 20% bullhead, 15% catfish, 15% perch, 20% walleye
Correct Answer:

Verified
Correct Answer:
Verified
Q16: Consider an experiment in which female and
Q17: Multiple histograms and grouped bar graphs are
Q18: Grouped bar graphs and mosaic plots are
Q19: If you saw a graph with rectangles
Q20: Consider the histograms of a data set
Q22: Which of the following is a good
Q23: Consider a situation in which bacterial
Q24: Bar graphs, histograms, and scatter plots should
Q25: The primary purpose of scatter plots is
Q26: Consider the histogram shown. What two words