Multiple Choice
Consider an experiment in which female and male rats are weighed and then their food consumption is measured. Which of the following is NOT a flaw in the figure showing data from this experiment?
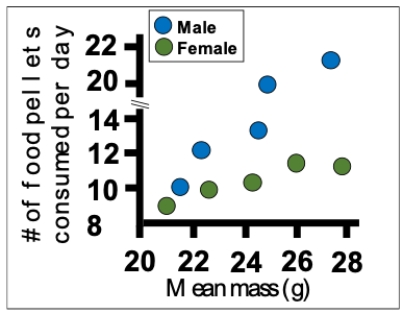
A) The fonts used for the two axes are different and both hard to read.
B) The symbols have identical shapes and colors with very similar shades.
C) The x-axis should extend all the way to zero to show magnitude.
D) The y-axis has a discontinuity, a sudden jump in magnitude.
Correct Answer:

Verified
Correct Answer:
Verified
Q11: Consider a situation in which bacterial
Q12: Preparing figures typically follows data analysis.
Q13: One of the graphical methods in particular
Q14: Write out a procedure or recipe for
Q15: Mosaic plots and grouped bar graphs display
Q17: Multiple histograms and grouped bar graphs are
Q18: Grouped bar graphs and mosaic plots are
Q19: If you saw a graph with rectangles
Q20: Consider the histograms of a data set
Q21: Consider a lake survey in which the