Multiple Choice
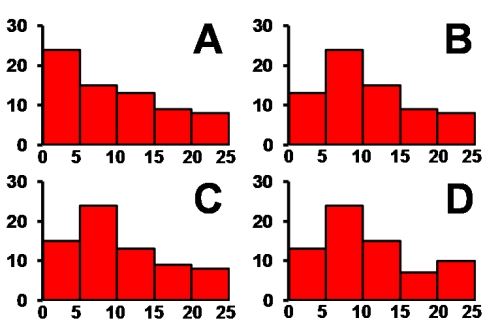
Consider the data table that indicates how many subjects in a skin cancer study had various sizes of moles on their backs. Which of the histograms correctly depicts the data?
Frequency table showing the average size of moles on 70 subjects.
 ?
?
?
A) Chart A
B) Chart B
C) Chart C
D) Chart D
Correct Answer:

Verified
Correct Answer:
Verified
Q33: Consider an experiment in which an omnivorous
Q34: There is no strict rule for choosing
Q35: Consider an experiment in which rats are
Q36: Consider an experiment in which rats are
Q37: Which of the following would greatly
Q39: Effective graphs are designed to accomplish three
Q40: Which of the following is generally true
Q41: When looking at a color map that
Q42: When designing a table of data values,
Q43: What of the following is the best