Multiple Choice
Consider an experiment in which an omnivorous species has its stomach contents analyzed. Which of the pie charts correctly depicts the following values for the diet of the omnivore:
Fish = 10%
Grass = 40%,
Insects = 20%
Leaves = 30%
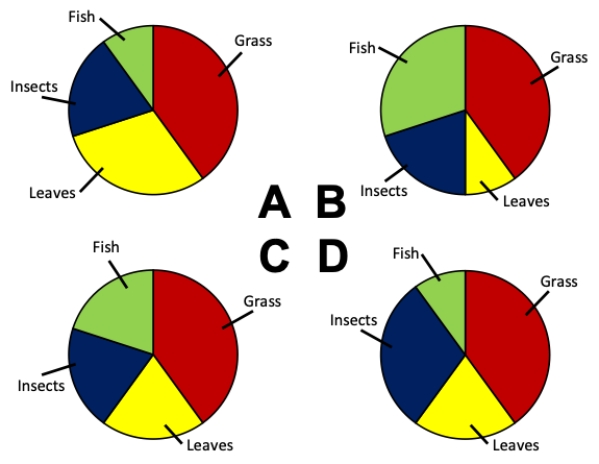
A) Chart A
B) Chart B
C) Chart C
D) Chart D
Correct Answer:

Verified
Correct Answer:
Verified
Related Questions
Q28: Multiple histograms and group bar graphs both
Q29: Bar graphs are typically superior to pie
Q30: Strip plots and violin plots are typically
Q31: Consider a situation in which tumor-prone
Q32: Consider a lake survey in which the
Q34: There is no strict rule for choosing
Q35: Consider an experiment in which rats are
Q36: Consider an experiment in which rats are
Q37: Which of the following would greatly
Q38: Consider the data table that indicates