Multiple Choice
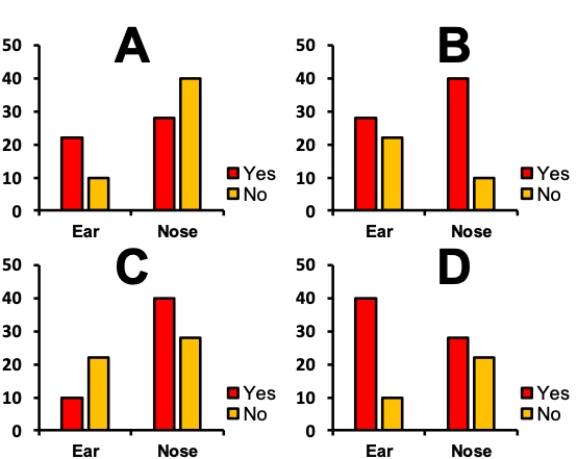
Consider a situation in which bacterial swabs were taken from the ears and noses of 50 study subjects, and the number of swabs that showed the presence of staphylococcus were measured. The table shows the results of the measurements. Which of the grouped bar graphs shown correctly depicts this data?
?
Contingency table showing presence of Staphylococcus in swabs from different body parts.
? ?
?
A) Plot A
B) Plot B
C) Plot C
D) Plot D
Correct Answer:

Verified
Correct Answer:
Verified
Q22: Which of the following is a good
Q23: Consider a situation in which bacterial
Q24: Bar graphs, histograms, and scatter plots should
Q25: The primary purpose of scatter plots is
Q26: Consider the histogram shown. What two words
Q28: Multiple histograms and group bar graphs both
Q29: Bar graphs are typically superior to pie
Q30: Strip plots and violin plots are typically
Q31: Consider a situation in which tumor-prone
Q32: Consider a lake survey in which the