Multiple Choice
Consider a lake survey in which the relative amounts of five different types of fish are identified. Which of the following data sets matches the pie chart shown?
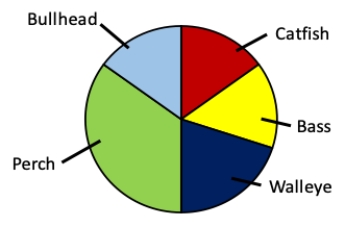
A) 15% bass, 15% bullhead, 15% catfish, 40% perch, 15% walleye
B) 15% bass, 15% bullhead, 15% catfish, 35% perch, 20% walleye
C) 20% bass, 15% bullhead, 20% catfish, 30% perch, 15% walleye
D) 20% bass, 15% bullhead, 15% catfish, 30% perch, 20% walleye
Correct Answer:

Verified
Correct Answer:
Verified
Q27: Consider a situation in which bacterial
Q28: Multiple histograms and group bar graphs both
Q29: Bar graphs are typically superior to pie
Q30: Strip plots and violin plots are typically
Q31: Consider a situation in which tumor-prone
Q33: Consider an experiment in which an omnivorous
Q34: There is no strict rule for choosing
Q35: Consider an experiment in which rats are
Q36: Consider an experiment in which rats are
Q37: Which of the following would greatly