Multiple Choice
The interaction plot shown most likely represents which of the following?
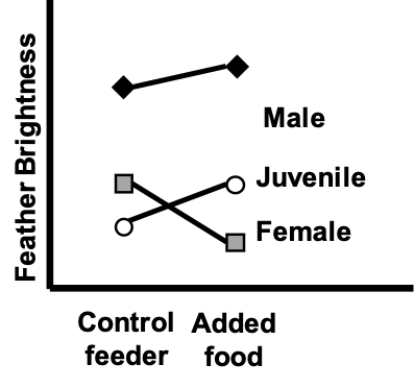
A) Associations with diet and bird age/sex, and an interaction
B) Associations with diet and bird age/sex treatment, but no interaction
C) An association with diet and an interaction, but no effect of bird age/sex
D) An association with bird age/sex and an interaction, but no effect of diet
Correct Answer:

Verified
Correct Answer:
Verified
Q2: The calculation of the F-value for a
Q3: Imagine we wish to perform an ANCOVA
Q4: An ANCOVA analysis typically uses two categorical
Q5: Data points for various species are generally
Q6: In a randomized block design with each
Q7: What is the purpose of adding a
Q8: Imagine an ANCOVA with one numerical explanatory
Q9: The interaction plot shown most likely represents
Q10: Imagine an ANCOVA with one numerical explanatory
Q11: The interaction plot shown most likely represents