Multiple Choice
The interaction plot shown most likely represents which of the following?
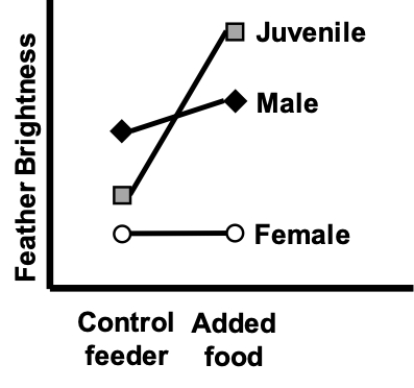
A) Associations with diet and bird age/sex, and an interaction
B) Associations with diet and bird age/sex treatment, but no interaction
C) An association with diet, but no effect of bird age/sex or any interaction
D) An association with fertilizer treatment, but no effect of diet or any interaction
Correct Answer:

Verified
Correct Answer:
Verified
Q15: Imagine a factorial ANOVA design experiment with
Q16: The interaction plot shown most likely represents
Q17: A two-factor ANOVA analysis using a factorial
Q18: The best definition of a mathematical mode
Q19: In a randomized block design with each
Q21: In the linear model RESPONSE = CONSTANT
Q22: In an interaction plot, the two factors
Q23: Blocking factors are considered explanatory factors in
Q24: Which of the following is not an
Q25: For the figure shown, which of the