Multiple Choice
For the figure shown, which of the four plots most likely shows a situation where both factors have a significant association with the response variable?
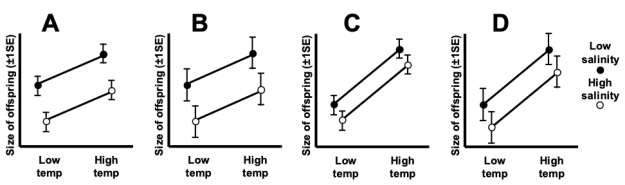
A) Plot A
B) Plot B
C) Plot C
D) Plot D
Correct Answer:

Verified
Correct Answer:
Verified
Related Questions
Q20: The interaction plot shown most likely represents
Q21: In the linear model RESPONSE = CONSTANT
Q22: In an interaction plot, the two factors
Q23: Blocking factors are considered explanatory factors in
Q24: Which of the following is not an
Q26: Imagine a factorial ANOVA design experiment with
Q27: When linear models include more than one
Q28: When the assumptions of the linear model
Q29: Draw a flowchart showing the decisions you
Q30: The interaction plot shown most likely represents