Multiple Choice
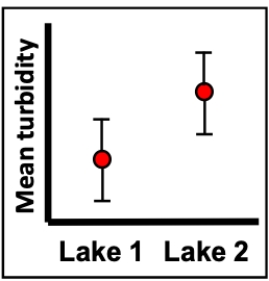
Imagine a series of turbidity (cloudiness) measurements in the water from two different lakes. The measurements were taken over many different days (30 samples for each lake) and the figure shows the mean turbidity of those measurements along with bars representing 95% confidence intervals. What can we conclude about the appropriate null hypothesis and mean turbidity of the two lakes?
A) Fail to reject the null hypothesis, we lack evidence that the turbidity differs between the lakes.
B) Reject the null hypothesis, we have evidence that the turbidity differs between the lakes.
C) Reject the null hypothesis, we lack evidence that the turbidity differs between the lakes.
D) We can't really tell from this figure whether the null hypothesis will be rejected or not.
Correct Answer:

Verified
Correct Answer:
Verified
Q43: When a figure shows means and bars
Q44: If the 95% confidence interval for the
Q45: Consider a study in which two sets
Q46: Consider a situation in which Chris
Q47: In a paired design, numerical values from
Q48: Consider an urban ecologist who is interested
Q49: Consider a situation in which Chris
Q50: When a figure shows means and bars
Q51: Consider a situation in which Chris
Q52: When a figure shows means and bars