Not Answered
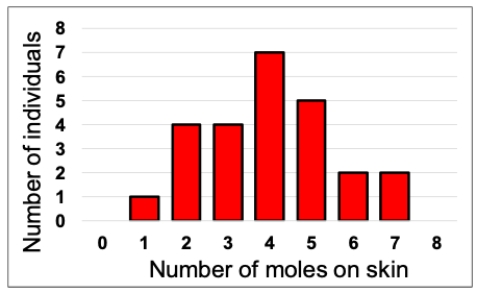
Consider the figure shown indicating the number of moles on the skin of a set of 25 patients examined by a dermatologist. Published reports claim that the mean number for the population these patients come from is 3.5 moles. Conduct a one-sample t-test on this data and determine whether this seems to be true. Assume a = 0.5. In your answer present the following: your calculated t-value, an exact P-value using a computer or a range for the P-value using a table of critical values, and a statement about whether the population mean appears to be 3.5 or not based on the sample.
Correct Answer:

Verified
Correct Answer:
Verified
Q2: Consider a situation in which Jamal measures
Q3: Using your table of critical t-values, what
Q4: For the data set shown below,
Q5: If a sample with 34 values has
Q6: For a pair of samples with the
Q7: If we have a 95% confidence interval
Q8: If we have a sample of 14
Q9: Consider a data sample consisting of 12
Q10: What is the correct representation for the
Q11: For the data set shown below,