Multiple Choice
(Figure: Understanding Network Good Markets) The graph depicts the market for a network good. What does G represent?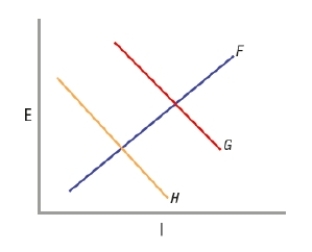
A) price
B) private demand
C) social demand
D) quantity
Correct Answer:

Verified
Correct Answer:
Verified
Related Questions
Q288: GoGo Games awards its loyalty-program customers with
Q289: To ensure that no firm has exclusive
Q290: Draw a graph with a network demand
Q291: (Figure: Externalities and Network Effects) Based on
Q292: Customers who purchase a network good after
Q294: Which point would represent a vicious cycle
Q295: Network externalities are subject to diminishing returns.
Q296: BlackBerry, MySpace, and PlayStation are all products
Q297: The Apple Watch was released in the
Q298: An increase in supply leads to an