Multiple Choice
(Figure: Market for a Network Good 2) The graph depicts the market for a network good. What point represents the tipping point?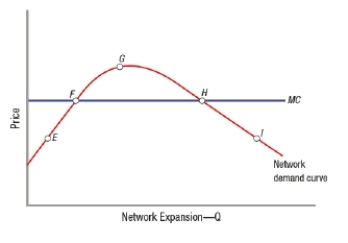
A) E
B) F
C) G
D) H
Correct Answer:

Verified
Correct Answer:
Verified
Related Questions
Q273: Network goods differ from other types of
Q274: Cable customers often purchase ESPN, whether they
Q275: A network good is one with which
Q276: Versioning is a type of intertemporal pricing.
Q277: (Figure: Market Equilibrium for a Network Good)
Q279: Equilibrium for a network good is at
Q280: (Figure: Peak-Load Pricing Model) The graph represents
Q281: Twitter and Facebook are products that can
Q282: What is a difference between "core users"
Q283: What explains the change in slope of