Multiple Choice
(Figure: Peak-Load Pricing Model) The graph represents the market for a good that follows a peak-load pricing model. Which curve represents demand during a nonpeak period?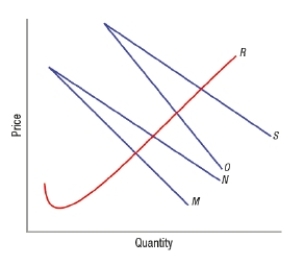
A) M
B) N
C) O
D) S
Correct Answer:

Verified
Correct Answer:
Verified
Related Questions
Q275: A network good is one with which
Q276: Versioning is a type of intertemporal pricing.
Q277: (Figure: Market Equilibrium for a Network Good)
Q278: (Figure: Market for a Network Good 2)
Q279: Equilibrium for a network good is at
Q281: Twitter and Facebook are products that can
Q282: What is a difference between "core users"
Q283: What explains the change in slope of
Q284: A country club is not a social
Q285: When a consumer joins a network, the