True/False
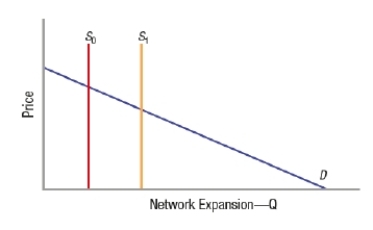
(Figure: Network Goods and Fixed Capacities) The graph represents a small network with a fixed capacity. If capacity decreases from S1 to S0, D rotates downward, and price decreases.
Correct Answer:

Verified
Correct Answer:
Verified
Related Questions
Q71: Network demand curves<br>A) are downward sloping.<br>B) slope
Q72: A pricing strategy that involves pricing a
Q73: When a virtuous cycle is impacting the
Q74: The tipping point is the quantity from
Q75: The train wheel gauge (the distance between
Q77: (Figure: Market for a Network Good 2)
Q78: Casual users of a network good purchase
Q79: A network effect generally pushing prices _
Q80: Network goods differ from other types of
Q81: The short-run supply curve for a network