menu-iconExamlexExamLexServices

Discover

Ask a Question
  1. All Topics
  2. Topic
    Business
  3. Study Set
    Microeconomics Principles for a Changing World
  4. Exam
    Exam 14: Network Goods
  5. Question
    (Figure: Market for a Network Good 2) the Graph Depicts
Solved

(Figure: Market for a Network Good 2) the Graph Depicts

Question 77

Question 77

True/False

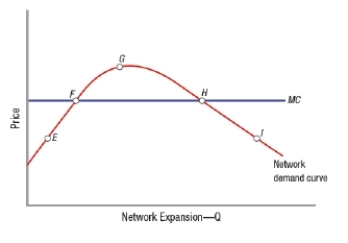
(Figure: Market for a Network Good 2) The graph depicts a market for a network good. If demand falls to the left of point F, the company will gain market share.

Correct Answer:

verifed

Verified

Unlock this answer now
Get Access to more Verified Answers free of charge

Related Questions

Q72: A pricing strategy that involves pricing a

Q73: When a virtuous cycle is impacting the

Q74: The tipping point is the quantity from

Q75: The train wheel gauge (the distance between

Q76: (Figure: Network Goods and Fixed Capacities) The

Q78: Casual users of a network good purchase

Q79: A network effect generally pushing prices _

Q80: Network goods differ from other types of

Q81: The short-run supply curve for a network

Q82: Which of these is NOT a strategy

Examlex

ExamLex

About UsContact UsPerks CenterHomeschoolingTest Prep

Work With Us

Campus RepresentativeInfluencers

Links

FaqPricingChrome Extension

Download The App

Get App StoreGet Google Play

Policies

Privacy PolicyTerms of ServiceHonor CodeCommunity Guidelines

Scan To Download

qr-code

Copyright © (2025) ExamLex LLC.

Privacy PolicyTerms Of ServiceHonor CodeCommunity Guidelines