Multiple Choice
(Figure: Interpreting Short-Run Supply Curves) Based on the graph, which of the curves would MOST likely depict a supply curve in the long run?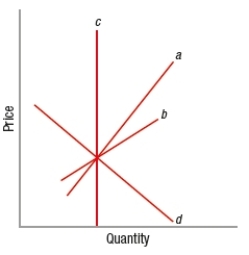
A) a
B) b
C) c
D) d
Correct Answer:

Verified
Correct Answer:
Verified
Related Questions
Q190: (Figure: Impact of Tax on Market Equilibrium)
Q191: Two goods are close substitutes for each
Q192: If the demand for Quilted Northern bath
Q193: Tax incidence usually falls<br>A) only on consumers.<br>B)
Q194: The demand for a vacation in Europe
Q196: Suppose that the price elasticity of supply
Q197: Using the midpoints of price and quantity
Q198: In general, the burden of taxes falls
Q199: Which good is the MOST income inelastic?<br>A)
Q200: If demand is extremely elastic, it is