Multiple Choice
(Figure: Impact of Tax on Market Equilibrium) Based on the graph, the deadweight loss created by the tax equals _____, and it is borne primarily by the _____.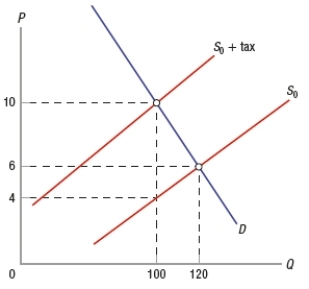
A) $60; buyer
B) $60; seller
C) $120; buyer
D) $120; seller
Correct Answer:

Verified
Correct Answer:
Verified
Q185: If the demand for bread is inelastic,
Q186: Which statement is TRUE?<br>A) Elasticity of demand
Q187: State sales taxes are considered by many
Q188: If soda and potato chips are complements,
Q189: (Figure: Interpreting Short-Run Supply Curves) Based on
Q191: Two goods are close substitutes for each
Q192: If the demand for Quilted Northern bath
Q193: Tax incidence usually falls<br>A) only on consumers.<br>B)
Q194: The demand for a vacation in Europe
Q195: (Figure: Interpreting Short-Run Supply Curves) Based on