Multiple Choice
(Figure: Determining Elasticity of Supply) The graph has four supply curves. Which curve represents the supply curve in the market period?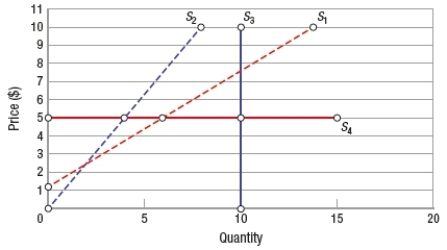
A) S1
B) S2
C) S3
D) S4
Correct Answer:

Verified
Correct Answer:
Verified
Related Questions
Q159: Suppose that the quantity demanded of a
Q160: Suppose the price of a bag of
Q161: (Figure) The figure shows two supply curves
Q162: If demand is inelastic, the tax incidence
Q163: Which of these would result in a
Q165: (Figure: Effects of Excise Tax) Based on
Q166: Which of these indicates a possible income
Q167: If the price of a product falls
Q168: An inferior good is a good that<br>A)
Q169: If oranges cost $4 a bag last