Multiple Choice
(Figure) The figure shows two supply curves for two different periods for the same product. Based on the information in the graph, which statement is TRUE?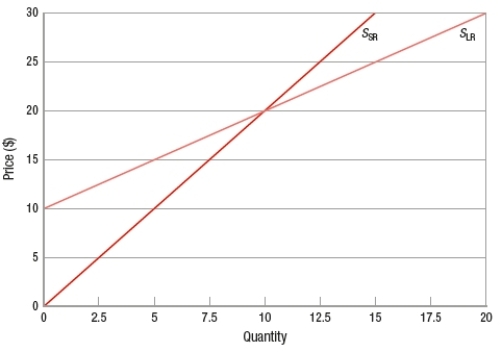
A) The flatter long-run supply curve implies that the price elasticity of supply is smaller compared to the short run.
B) The flatter long-run supply curve implies that the price elasticity of supply is greater compared to the short run.
C) The steeper short-run supply curve implies that the price elasticity of supply is equal to the long run.
D) The steeper short-run supply curve implies that the price elasticity of supply is larger compared to the long run.
Correct Answer:

Verified
Correct Answer:
Verified
Q156: A demand curve that is inelastic<br>A) means
Q157: Describe how time affects price elasticity of
Q158: If hot dogs and relish are complements,
Q159: Suppose that the quantity demanded of a
Q160: Suppose the price of a bag of
Q162: If demand is inelastic, the tax incidence
Q163: Which of these would result in a
Q164: (Figure: Determining Elasticity of Supply) The graph
Q165: (Figure: Effects of Excise Tax) Based on
Q166: Which of these indicates a possible income