Multiple Choice
The following figure shows the demand and supply curves for USB flash drives at different price levels. D is the demand curve, and S₁ is the initial supply curve.
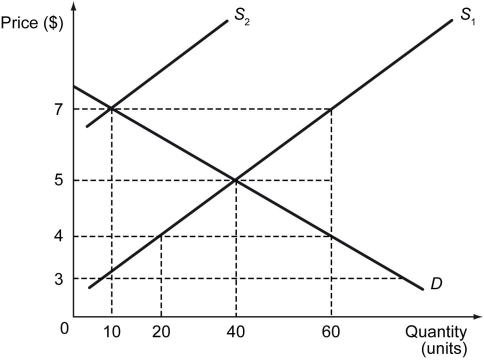
-Refer to the figure above.When the demand curve for flash drives is D and the supply curve of flash drives is S₁,what is the shortage in the market if the price is $4?
A) 0 units
B) 10 units
C) 20 units
D) 40 units
Correct Answer:

Verified
Correct Answer:
Verified
Q54: The following table shows the market demand
Q55: Other things remaining same,a leftward shift in
Q56: The following table shows the supply schedule
Q57: At a price of $1 per table,the
Q58: Two goods are said to be substitutes
Q60: The _ plots the relationship between prices
Q61: <img src="https://d2lvgg3v3hfg70.cloudfront.net/TB1359/.jpg" alt=" -Refer to the
Q62: Which of the following examples best describes
Q63: Which of the following statements is true
Q64: Consider a market where the demand curve