Multiple Choice
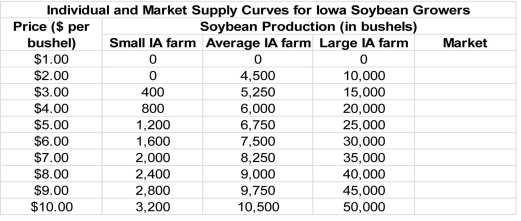
-Refer to the table above.Which producer exhibits the greatest increase in quantity supplied for a $1.00 per bushel increase in the price of soybeans?
A) The small Iowa farm
B) The average Iowa farm
C) The large Iowa farm
D) Both the average and large Iowa farms
Correct Answer:

Verified
Correct Answer:
Verified
Related Questions
Q56: The following table shows the supply schedule
Q57: At a price of $1 per table,the
Q58: Two goods are said to be substitutes
Q59: The following figure shows the demand and
Q60: The _ plots the relationship between prices
Q62: Which of the following examples best describes
Q63: Which of the following statements is true
Q64: Consider a market where the demand curve
Q65: All else being equal,an increase in the
Q66: Scenario: A market researcher asks three consumers,