Multiple Choice
The following figure shows labor supply and demand curves.
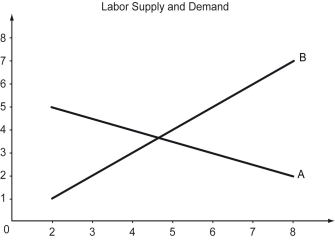
-Refer to the figure above.What is the appropriate label for the x-axis?
A) Labor demanded
B) Quantity of labor
C) Labor supplied
D) Wage rate
Correct Answer:

Verified
Correct Answer:
Verified
Related Questions
Q62: Which of the following statements is true?<br>A)
Q63: As a firm hires more and more
Q64: The impact of an increase in the
Q65: Everything else remaining unchanged,what is likely to
Q66: Scenario: Jim, Pam, Michael, and Angela all
Q68: Which of the following statements correctly differentiates
Q69: Scenario: Truck drivers across the country are
Q70: The following figure shows curves for labor
Q71: The following figure shows wage versus labor
Q72: Which of the following explains why frictional