Multiple Choice
The following figure shows curves for labor demand and labor supply.
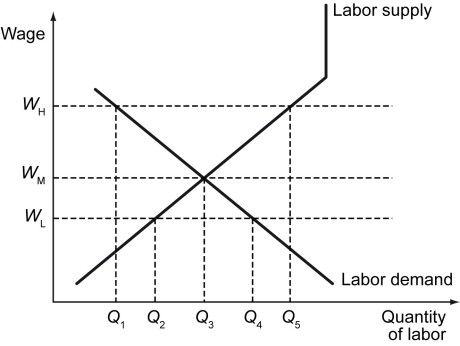
-Refer to the figure above.Without interference,the labor market clears at wage ________.Wage rigidity would cause the quantity of labor demanded to ________ and the quantity of labor supplied to ________.
A) Q₂; a quantity below Q₅; a quantity above Q₁
B) Q₃; a quantity above Q₃; a quantity below Q₃
C) Q₄; a quantity below Q₅; a quantity above Q₁
D) Q₃; a quantity below Q₃; a quantity above Q₃
Correct Answer:

Verified
Correct Answer:
Verified
Q65: Everything else remaining unchanged,what is likely to
Q66: Scenario: Jim, Pam, Michael, and Angela all
Q67: The following figure shows labor supply and
Q68: Which of the following statements correctly differentiates
Q69: Scenario: Truck drivers across the country are
Q71: The following figure shows wage versus labor
Q72: Which of the following explains why frictional
Q73: How can technological innovations be a source
Q74: Which of the following statements is true?<br>A)
Q75: The following table defines some population and