Multiple Choice
The following figure shows wage versus labor demand.
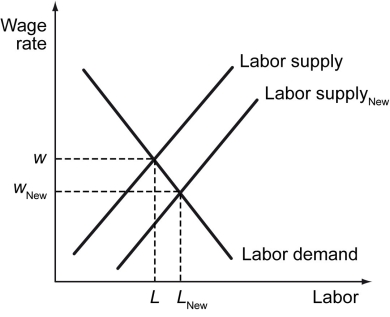
-Refer to the figure above.The shift from the labor supply curve to the new labor supply curve could be caused by ________.
A) an increase in the marginal productivity of labor
B) a decrease in the marginal productivity of labor
C) an increase in the opportunity cost of working
D) a decrease in the opportunity cost of working
Correct Answer:

Verified
Correct Answer:
Verified
Q132: The following figure shows wage versus labor
Q133: Which of the following statements is true?<br>A)
Q134: If the number of discouraged workers in
Q135: Scenario: 100 people live in Country X,
Q136: The following figure shows curves for labor
Q138: The following table compares labor statistics for
Q139: Scenario: Suppose an economy consists of only
Q140: A reduction in wage is most likely
Q141: Scenario: Consider Country A with a population
Q142: In a frictionless labor market,_.<br>A) there is