Multiple Choice
The following figure shows curves for labor demand and labor supply.
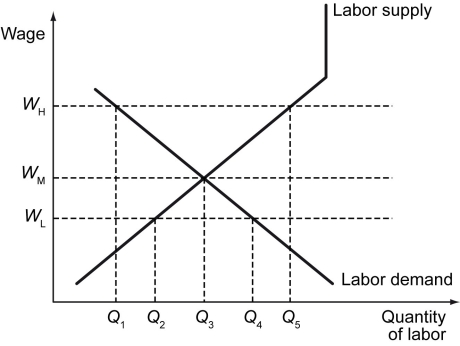
-Refer to the figure above.Collective bargaining leads to the negotiation of a new wage rate in the labor market.Which of the shifts in the quantity of labor supplied may be observed as a result of the negotiations?
A) A shift from Q₃ to Q₂
B) A shift from Q₃ to Q₁
C) A shift from Q₃ to Q₄
D) A shift from Q₃ to Q₅
Correct Answer:

Verified
Correct Answer:
Verified
Q131: Unemployment arising from job search is called
Q132: The following figure shows wage versus labor
Q133: Which of the following statements is true?<br>A)
Q134: If the number of discouraged workers in
Q135: Scenario: 100 people live in Country X,
Q137: The following figure shows wage versus labor
Q138: The following table compares labor statistics for
Q139: Scenario: Suppose an economy consists of only
Q140: A reduction in wage is most likely
Q141: Scenario: Consider Country A with a population