Essay
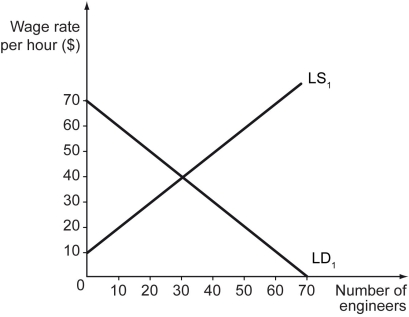
The following figure illustrates the labor demand curve,LD₁,and labor supply curve,LS₁,in the market for engineers.

a)What are the equilibrium wage rate and employment level in the market?
b)If the government thinks that engineers are underpaid in the country and fixes a minimum wage of $50 per hour,what will be the impact on the level of employment?
c)If engineers unionize themselves and negotiate a wage that is $30 higher than the market-clearing wage,what will be the impact on the employment level?
Correct Answer:

Verified
a)The equilibrium wage is determined by ...View Answer
Unlock this answer now
Get Access to more Verified Answers free of charge
Correct Answer:
Verified
View Answer
Unlock this answer now
Get Access to more Verified Answers free of charge
Q124: If there are 48 million people in
Q125: If the number of employed workers in
Q126: Which of the following is likely to
Q127: The following figure shows wage rate versus
Q128: Areas where whole industries disappear will most
Q130: If the unemployment rate among workers without
Q131: Unemployment arising from job search is called
Q132: The following figure shows wage versus labor
Q133: Which of the following statements is true?<br>A)
Q134: If the number of discouraged workers in