Multiple Choice
The following figure shows wage rate versus quantity of labor.
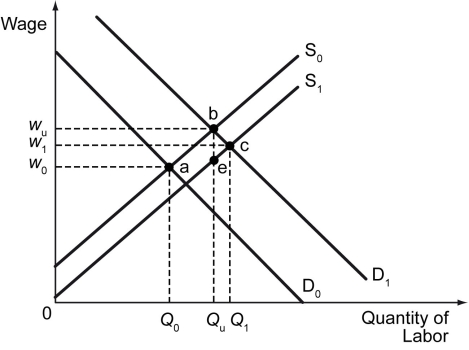
-Refer to the figure above.If S₀ is the supply of labor,D₀ is the labor demand curve during a cyclical downturn,and D₁ is the labor demand curve during a cyclical expansion,which expression best represents the natural rate of unemployment?
A) Qᵤ - Q₀
B) Qᵤ + Q₀
C) (Qᵤ + Q₀) /2
D) (Qᵤ - Q₀) /2
Correct Answer:

Verified
Correct Answer:
Verified
Q122: The size of the labor force in
Q123: The following figure shows wage rate versus
Q124: If there are 48 million people in
Q125: If the number of employed workers in
Q126: Which of the following is likely to
Q128: Areas where whole industries disappear will most
Q129: The following figure illustrates the labor demand
Q130: If the unemployment rate among workers without
Q131: Unemployment arising from job search is called
Q132: The following figure shows wage versus labor