Multiple Choice
The following figure shows curves for labor demand and labor supply.
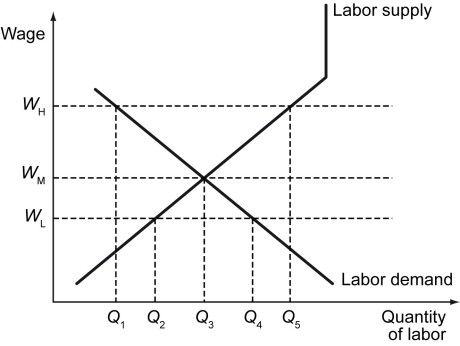
-Refer to the figure above.If a minimum wage law is imposed at WL,the market clearing quantity of labor will change from ________ to ________.
A) Q₃; Q₃ (It will remain unchanged)
B) Q₃; Q₂
C) Q₅; Q₃
D) Q₃; Q₄
Correct Answer:

Verified
Correct Answer:
Verified
Q146: Which of the following statements is true
Q147: _ increase workers' productivity and improve the
Q148: The impact of a decrease in the
Q149: The following table shows some labor statistics
Q150: Scenario: The unemployment rate in Country Y
Q152: International trade generally _.<br>A) leads to lower
Q153: The following table defines some population and
Q154: Explain the differences between frictional unemployment and
Q155: As the wage rate increases,the _,assuming all
Q156: Unemployment that arises when there is a