Multiple Choice
The following table shows some labor statistics for four years.
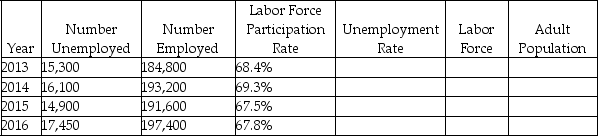
-Refer to the table above.Which year had the highest unemployment rate?
A) 2013
B) 2014
C) 2015
D) 2016
Correct Answer:

Verified
Correct Answer:
Verified
Related Questions
Q144: Which of the following is likely to
Q145: Which of the following is likely to
Q146: Which of the following statements is true
Q147: _ increase workers' productivity and improve the
Q148: The impact of a decrease in the
Q150: Scenario: The unemployment rate in Country Y
Q151: The following figure shows curves for labor
Q152: International trade generally _.<br>A) leads to lower
Q153: The following table defines some population and
Q154: Explain the differences between frictional unemployment and