Multiple Choice
The following figure shows the demand and supply curve for dollars against the rupee.
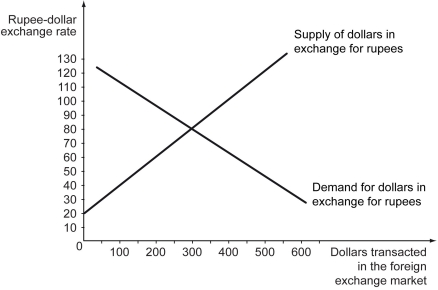
-Refer to the figure above.The equilibrium exchange rate in this case is ________.
A) 20 rupees per dollar
B) 40 rupees per dollar
C) 80 rupees per dollar
D) 130 rupees per dollar
Correct Answer:

Verified
Correct Answer:
Verified
Related Questions
Q64: The following table shows the exchange rate
Q65: In the foreign exchange market,the higher the
Q66: Why was George Soros known as the
Q67: If the government of a country adopts
Q68: The dollar demand curve in the foreign
Q70: The exchange rate of a currency in
Q71: If a toy costs 30 yuan in
Q72: Everything else being equal,a depreciation of the
Q73: How do black markets for currencies form?
Q74: The following figure shows the net exports