True/False
The following figure shows the net exports curve for a country:
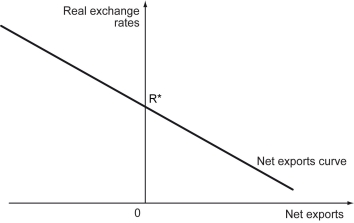
-Refer to the figure above.When the real exchange rate is above R*,there is a trade surplus.
Correct Answer:

Verified
Correct Answer:
Verified
Related Questions
Q69: The following figure shows the demand and
Q70: The exchange rate of a currency in
Q71: If a toy costs 30 yuan in
Q72: Everything else being equal,a depreciation of the
Q73: How do black markets for currencies form?
Q75: Which of the following statements is true?<br>i.The
Q76: Everything else being equal,a depreciation of the
Q77: The yuan-dollar exchange rate is currently _.<br>A)
Q78: Everything else being equal,an appreciation of the
Q79: In the foreign exchange market,the lower the