menu-iconExamlexExamLexServices

Discover

Ask a Question
  1. All Topics
  2. Topic
    Business
  3. Study Set
    Economics Principles and Policy Study Set 2
  4. Exam
    Exam 24: Aggregate Demand and the Powerful Consumer
  5. Question
    Figure 8-1 ​
Solved

Figure 8-1 ​

Question 20

Question 20

Multiple Choice

Figure 8-1
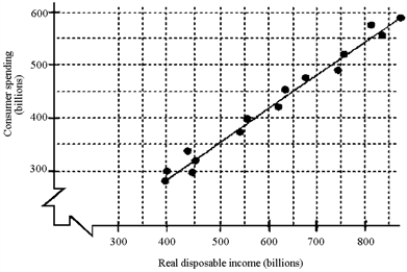
​ Figure 8-1 ​   -Based on the scatter diagram in Figure 8-1, approximately how much will consumption increase after a permanent tax cut of $400 billion? A) $100 billion B) $150 billion C) $250 billion D) $350 billion
-Based on the scatter diagram in Figure 8-1, approximately how much will consumption increase after a permanent tax cut of $400 billion?


A) $100 billion
B) $150 billion
C) $250 billion
D) $350 billion

Correct Answer:

verifed

Verified

Unlock this answer now
Get Access to more Verified Answers free of charge

Related Questions

Q15: Taxes are not considered a leakage because

Q16: The main reason that the 1975, 2008,

Q17: The difference between Gross National Product and

Q18: Suppose the stock market rises, causing a

Q19: If a U.S.citizen buys a car produced

Q21: The tax cut of 2009 had little

Q22: Figure 8-1<br>​ <img src="https://d2lvgg3v3hfg70.cloudfront.net/TB8592/.jpg" alt="Figure 8-1 ​

Q23: The largest component of aggregate demand is<br>A)investment

Q24: A scatter diagram could help a policy

Q25: Which of the following will most likely

Examlex

ExamLex

About UsContact UsPerks CenterHomeschoolingTest Prep

Work With Us

Campus RepresentativeInfluencers

Links

FaqPricingChrome Extension

Download The App

Get App StoreGet Google Play

Policies

Privacy PolicyTerms of ServiceHonor CodeCommunity Guidelines

Scan To Download

qr-code

Copyright © (2025) ExamLex LLC.

Privacy PolicyTerms Of ServiceHonor CodeCommunity Guidelines