Multiple Choice
Figure 10-2
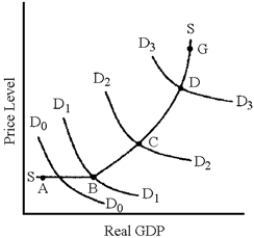
-In Figure 10-2, which segment of the aggregate supply curve has the largest multiplier effect?
A) AB
B) BC
C) CD
D) DG
Correct Answer:

Verified
Correct Answer:
Verified
Q214: If the data show that periods of
Q215: Figure 10-1<br> <img src="https://d2lvgg3v3hfg70.cloudfront.net/TB8592/.jpg" alt="Figure 10-1
Q216: Figure 10-5 <img src="https://d2lvgg3v3hfg70.cloudfront.net/TB8592/.jpg" alt="Figure 10-5
Q217: What would be the likely result of
Q218: The aggregate supply curve shows how much
Q220: The major cost of production in the
Q221: Using aggregate demand and aggregate supply analysis,
Q222: The aggregate demand and aggregate supply curve
Q223: One complication in the process of reducing
Q224: Table 10-1 <img src="https://d2lvgg3v3hfg70.cloudfront.net/TB8592/.jpg" alt="Table 10-1