Multiple Choice
Figure 10-5 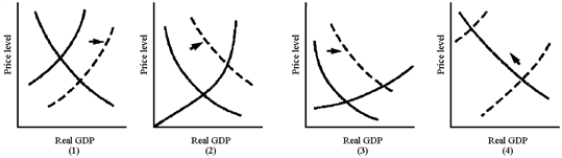
-In Figure 10-5, which graph best illustrates the situation of an economy with high unemployment that experiences an increase in investment spending?
A) (1)
B) (2)
C) (3)
D) (4)
Correct Answer:

Verified
Correct Answer:
Verified
Related Questions
Q78: A period of stagflation can be considered
Q79: An inflationary gap will occur when<br>A)real GDP
Q80: If short-run equilibrium GDP is above potential
Q81: What is the usual response of firm
Q82: Figure 10-7<br> <img src="https://d2lvgg3v3hfg70.cloudfront.net/TB8592/.jpg" alt="Figure 10-7
Q84: The only factor that can cause movement
Q85: If profit per unit equals (price −
Q86: The typical results of an adverse supply
Q87: For most firms in the economy, the
Q88: The equilibrium price level and the equilibrium