Multiple Choice
Figure 10-7
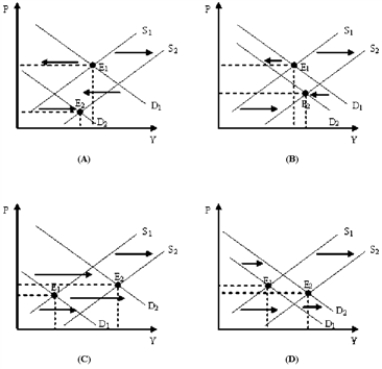
-Refer to Figure 10-7.Which of the diagrams in Figure 10-7 represents a decrease in consumer spending combined with a positive supply shock?
A) Panels (A) & (B)
B) Panels (C) & (D)
C) Panels (A) & (C)
D) Panels (B) & (D)
Correct Answer:

Verified
Correct Answer:
Verified
Q17: The aggregate supply curve will shift to
Q28: Wage decreases lead to a decrease in
Q29: In response to the demands of environmentalists,
Q31: When the inflationary gap is finally eliminated,
Q33: Figure 10-4<br> <img src="https://d2lvgg3v3hfg70.cloudfront.net/TB2282/.jpg" alt="Figure 10-4
Q36: The aggregate supply curve normally<br>A)slopes downward and
Q64: Table 10-1 <img src="https://d2lvgg3v3hfg70.cloudfront.net/TB8592/.jpg" alt="Table 10-1
Q98: The usual results of an adverse supply
Q115: When equilibrium GDP is greater than potential
Q166: Stagflation may follow an inflationary boom.